
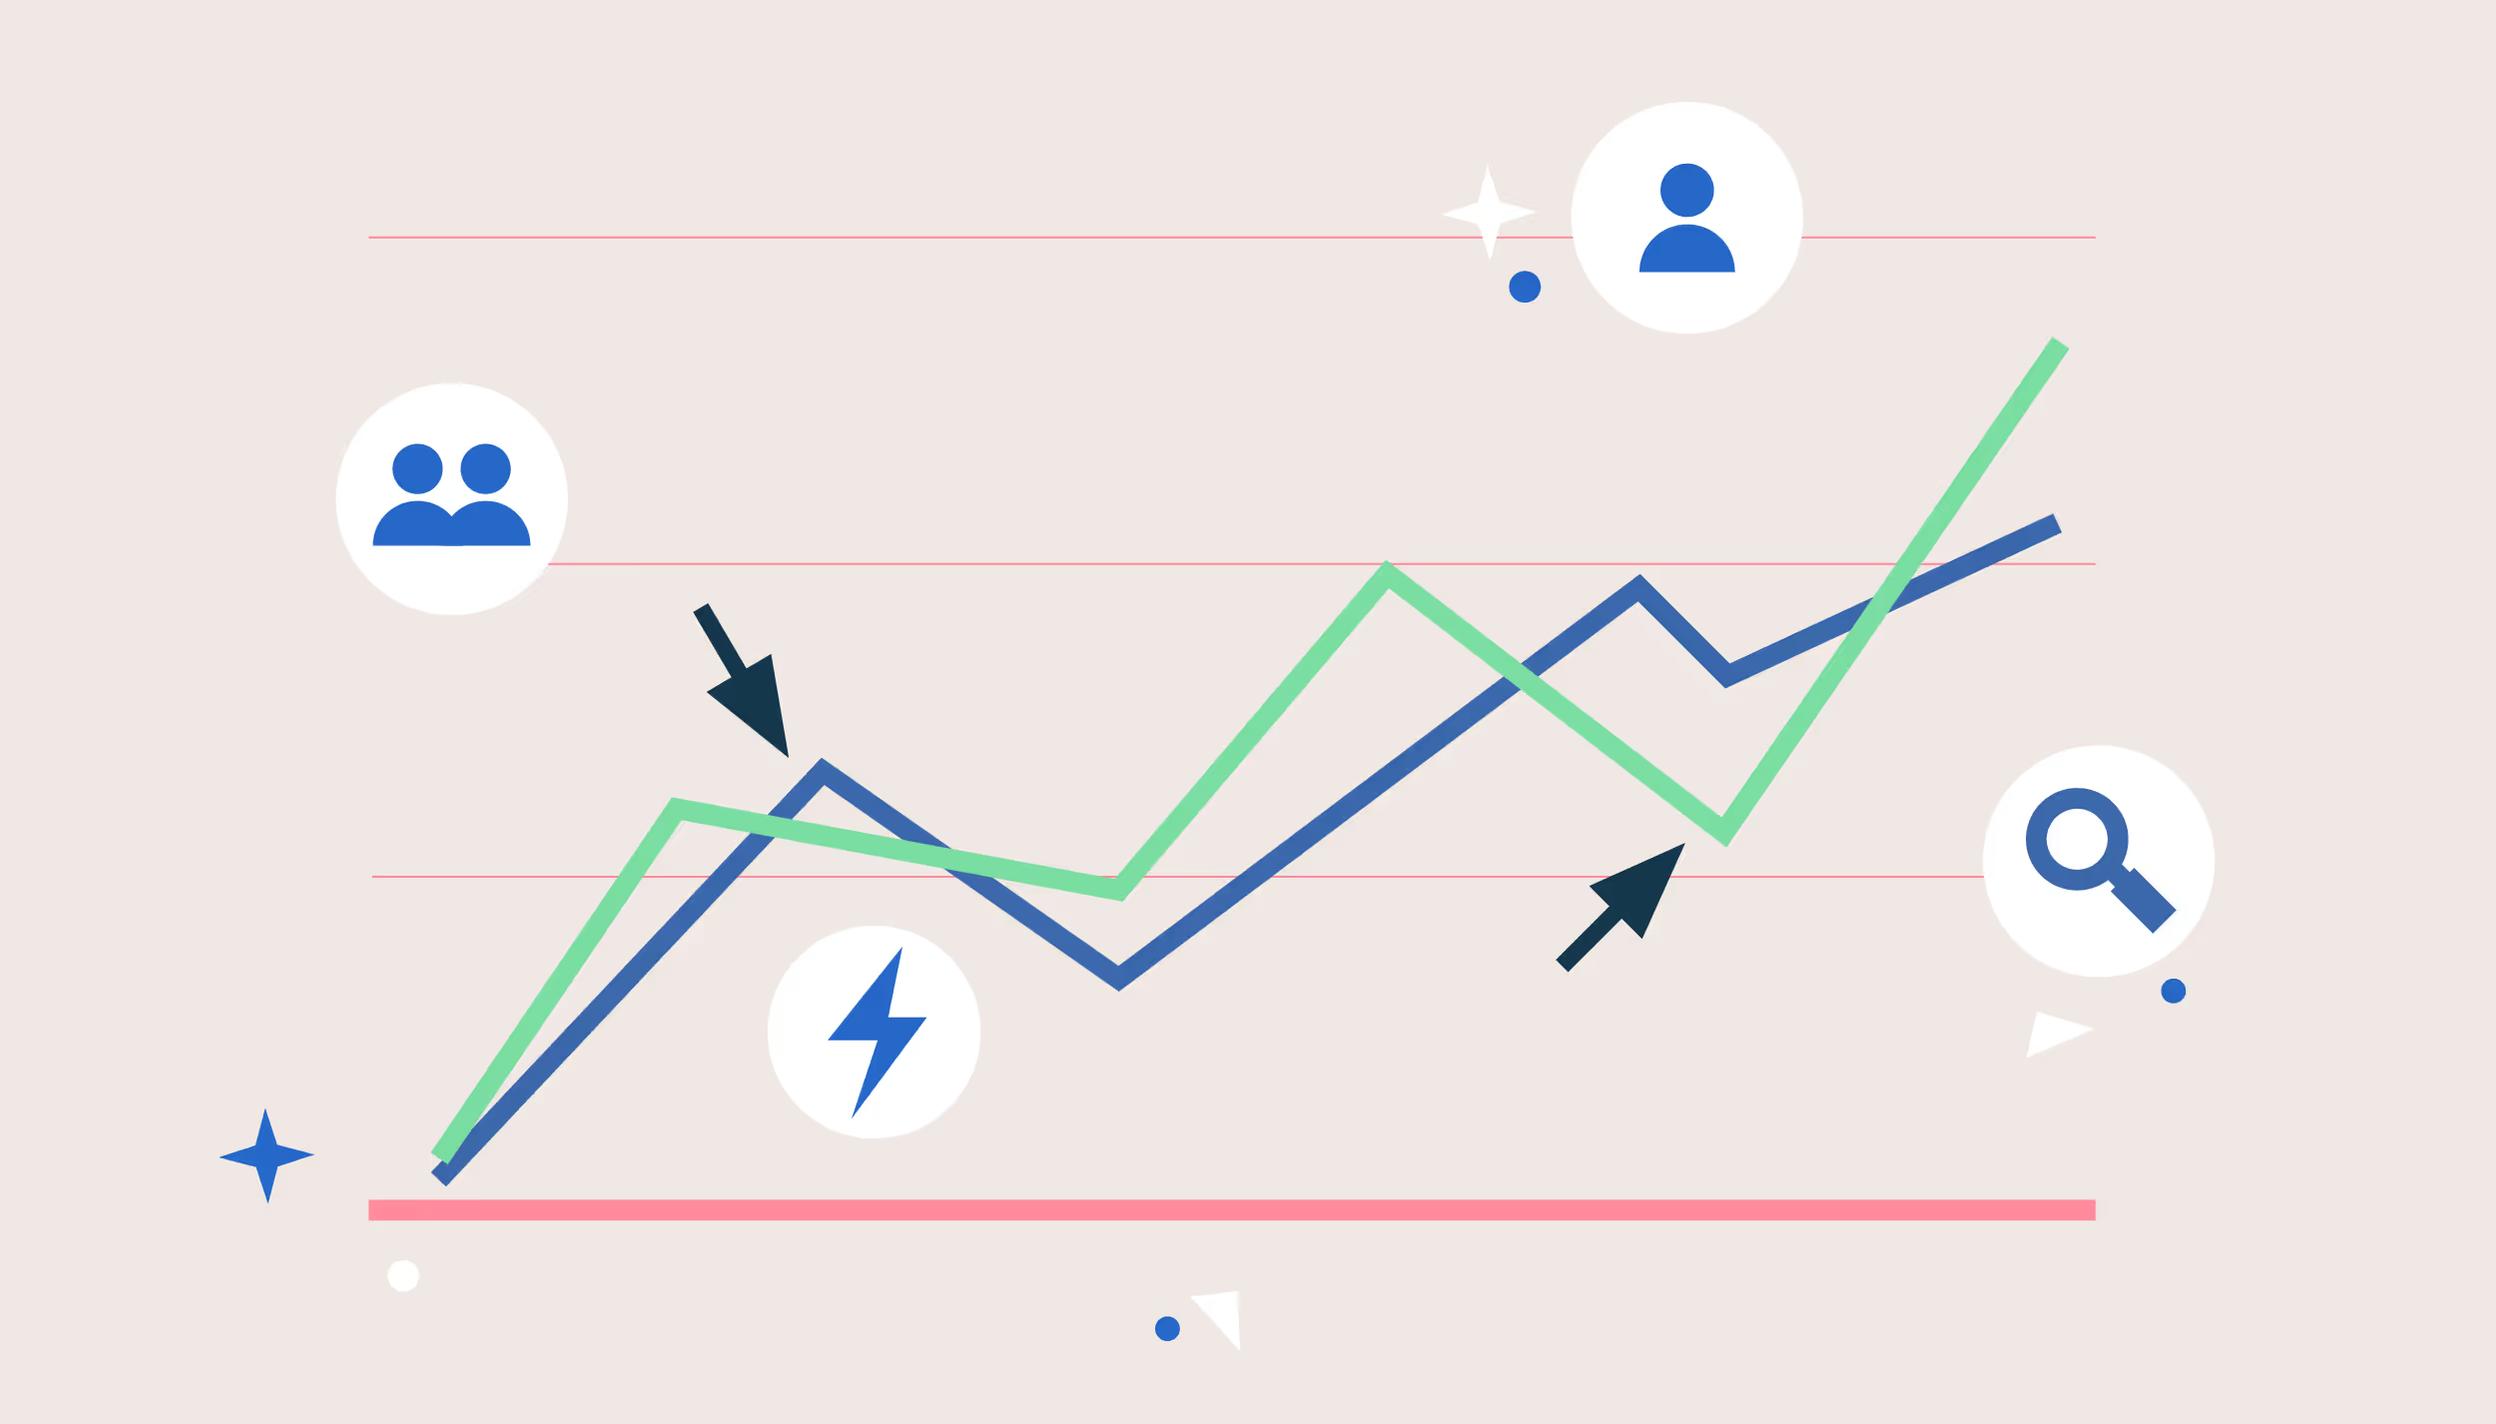
Daily metrics are noisy. A website can jump after a campaign, support tickets can surge after a release, and sales can dip because of a holiday. If you treat every spike and drop as a “real” change, you end up changing plans too often. Moving average smoothing is a simple remedy: it replaces sharp day-to-day swings with a steadier line so you can see long trends without guessing. This is why it shows up early in analytics practice, including in a data analysis course in Pune.
What smoothing really does (and what it does not)
Smoothing reduces random variation so the underlying trend and repeating patterns become easier to see. The engineering statistics handbook from NIST describes smoothing as a commonly used technique for revealing trend and cyclic components more clearly.
What it does not do is “fix” the data. If the data collection is broken, smoothing will only hide the problem. Think of it as better reading glasses, not better eyesight.
The rolling-window idea in plain English
A moving average is an average computed over the most recent k observations, where k is your window size. As new data arrives, the window moves forward by one step.
The most common version is the simple moving average (SMA):
SMA(t) = (x(t) + x(t−1) + … + x(t−k+1)) / k
You gain clarity, but you pay a price: the smoothed line reacts slower than the raw line. That delay is called lag—the trend line “lags behind” real turning points. Many public dashboards use 7-day moving averages because daily reporting fluctuates; even CDC documentation defines its 7-day totals using the current day plus the previous six days, divided by seven.
A small numerical example
Suppose your daily sign-ups for two weeks are:
42, 38, 35, 60, 58, 55, 30, 28, 26, 40, 44, 43, 41, 39
A 7-day moving average will start on day 7 (you need seven points first). The raw numbers look chaotic, but the rolling average will tell a cleaner story: a mid-period surge, a slump, and then a gradual recovery. That single view prevents the classic mistake of overreacting to one unusually good (or bad) day.
Picking the window size: the decision that matters most
Window size is not a technical footnote; it controls the story you see.
- Short windows (3–7 days): respond faster, but smooth less.
- Long windows (14–30 days): smooth more, but can hide meaningful changes.
A practical way to choose:
- Match the decision rhythm. If your team reviews weekly, a 7-day average fits how decisions are made.
- Cancel known patterns. If you have weekday/weekend swings, a 7-day window reduces that weekly “seasonality” (seasonality = a repeating pattern at regular intervals).
- Use two lenses. Overlay a short and a long moving average (for example, 7-day and 28-day). If both move in the same direction, you can be more confident the change is real.
This is also where judgement enters. Moving averages are excellent for communicating direction to stakeholders. They are less suitable for detecting sudden incidents (for that, you often need alerting rules, thresholds, or anomaly detection).
Where moving averages help (and where they can mislead)
Useful places to apply them
- Operations: ticket volume after releases—rolling averages show whether the baseline is drifting up over time.
- Marketing: conversion rates—smoothing highlights whether a channel is improving or just having a lucky week.
- Finance/demand: weekly sales—moving averages provide a simple baseline before deeper forecasting.
Common pitfalls
- False comfort: a smooth line can hide volatility underneath.
- Lag at turning points: the trend “confirms” a change after it has already started.
- Edge handling: early in a time series, you may have missing values until the first full window exists—be explicit about how you handle that in reports.
People often learn the calculation quickly in a data analyst course; the harder part is resisting over-interpretation. A rising 28-day average does not mean “everything is fine” if the last three days are collapsing. It means the longer baseline is still strong, and you need to look at both views before acting.
Conclusion
Moving average smoothing is a small technique with a big behavioural impact: it pushes teams away from reactive decisions and toward trend-based thinking. Used well, it becomes a shared dashboard language—raw data for transparency, rolling averages for direction, and windows chosen to match how the business operates. If you adopt that discipline—often emphasised in a data analysis course in Pune—smoothing stops being a charting trick and becomes a reliable way to read performance over time. The same habit supports a data analyst course mindset: make decisions you can justify.
BUSINESS DETAILS:
Name: Data Science, Data Analyst and Business Analyst Course in Pune
Address: First Floor, Sapphire Chambers, Spacelance Office Solutions Pvt. Ltd, 204, Baner Rd, Baner Gaon, Pune, Maharashtra 411069
Email ID: enquiry@excelr.com
Phone Number: 9945850527